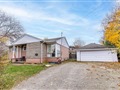
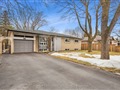
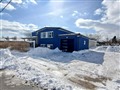
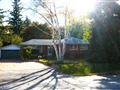
538 Weynway Crt
$1,305,792
Comparative Market Analysis
Jul 9, 2025
NOT AN ACTIVE LISTING
Historical Performance
| Period | $ Change | % Change |
| 1 Day | +$287 | +0.022% |
| 7 Days | +$93 | +0.007% |
| 30 Days | -$2,226 | -0.170% |
| 3 Months | -$2,218 | -0.170% |
| 6 Months | +$26.0k | +2.03% |
| 1 Year | -$52.0k | -3.83% |
| 3 Years | +$227k | +21.1% |
| 5 Years | +$424k | +48.1% |
| 10 Years | +$850k | +187% |
List My Property
Real Estate Statistics
Financing Solutions
Browsing History
3145 Ernest Applebe Blvd, Oakville
0 second ago
AS SEEN ON


Are You a Licensed Real Estate Agent or Broker?