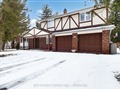
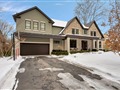
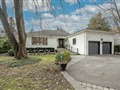
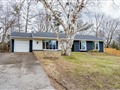
424 Maple Grove Dr
$3,659,221
Comparative Market Analysis
Jul 5, 2025
NOT AN ACTIVE LISTING
Historical Performance
| Period | $ Change | % Change |
| 1 Day | +$756 | +0.021% |
| 7 Days | -$554 | -0.015% |
| 30 Days | -$9,740 | -0.265% |
| 3 Months | -$16.7k | -0.455% |
| 6 Months | +$51.9k | +1.44% |
| 1 Year | -$195k | -5.07% |
| 3 Years | +$400k | +12.3% |
| 5 Years | +$760k | +26.2% |
| 10 Years | +$2.10m | +135% |
List My Property
Real Estate Statistics
Financing Solutions
AS SEEN ON


Are You a Licensed Real Estate Agent or Broker?