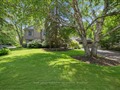
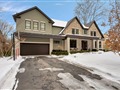
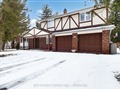
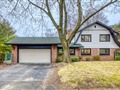
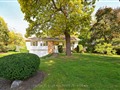
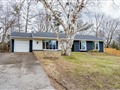
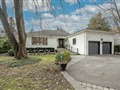
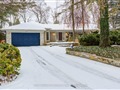
413 Claremont Cres
$2,537,401
Comparative Market Analysis
Jun 7, 2025
NOT AN ACTIVE LISTING
Historical Performance
| Period | $ Change | % Change |
| 1 Day | +$524 | +0.021% |
| 7 Days | -$384 | -0.015% |
| 30 Days | -$6,754 | -0.265% |
| 3 Months | -$11.6k | -0.455% |
| 6 Months | +$36.0k | +1.44% |
| 1 Year | -$130k | -4.89% |
| 3 Years | +$305k | +13.6% |
| 5 Years | +$601k | +31.0% |
| 10 Years | +$1.33m | +110% |
List My Property
Real Estate Statistics
Financing Solutions
Browsing History
1455 Albion Ave, Oakville
6 seconds ago
247 River Side Dr, Oakville
11 seconds ago
377 Pine Ave, Oakville
16 seconds ago
420 Canterbury Cres, Oakville
21 seconds ago
273 River Side Dr, Oakville
26 seconds ago
AS SEEN ON


Are You a Licensed Real Estate Agent or Broker?