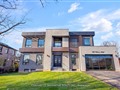
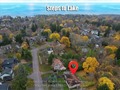
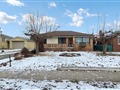
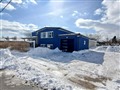
203 Sandwell Dr
$2,943,818
Comparative Market Analysis
Jun 18, 2025
NOT AN ACTIVE LISTING
Historical Performance
| Period | $ Change | % Change |
| 1 Day | +$648 | +0.022% |
| 7 Days | +$151 | +0.005% |
| 30 Days | -$5,309 | -0.180% |
| 3 Months | -$6,015 | -0.204% |
| 6 Months | +$56.3k | +1.95% |
| 1 Year | -$123k | -4.02% |
| 3 Years | +$484k | +19.7% |
| 5 Years | +$902k | +44.2% |
| 10 Years | +$1.89m | +178% |
List My Property
Real Estate Statistics
Financing Solutions
AS SEEN ON


Are You a Licensed Real Estate Agent or Broker?