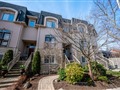
2013 Deerview Common
$1,223,655
Comparative Market Analysis
May 2, 2024
NOT AN ACTIVE LISTING
Historical Performance
| Period | $ Change | % Change |
| 1 Day | +$681 | +0.056% |
| 7 Days | +$1,756 | +0.144% |
| 30 Days | -$1,895 | -0.155% |
| 3 Months | -$6,530 | -0.531% |
| 6 Months | +$15.2k | +1.26% |
| 1 Year | -$62.0k | -4.82% |
| 3 Years | +$193k | +18.8% |
| 5 Years | +$289k | +30.9% |
| 10 Years | +$683k | +126% |
List My Property
Real Estate Statistics
Financing Solutions
AS SEEN ON

Are You a Licensed Real Estate Agent or Broker?