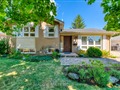
163 Sybella Dr
$1,770,510
Comparative Market Analysis
Jul 9, 2025
NOT AN ACTIVE LISTING
Historical Performance
| Period | $ Change | % Change |
| 1 Day | +$390 | +0.022% |
| 7 Days | -$69 | -0.004% |
| 30 Days | -$3,973 | -0.224% |
| 3 Months | -$6,100 | -0.343% |
| 6 Months | +$28.9k | +1.66% |
| 1 Year | -$85.2k | -4.59% |
| 3 Years | +$260k | +17.2% |
| 5 Years | +$491k | +38.3% |
| 10 Years | +$1.04m | +142% |
List My Property
Real Estate Statistics
Financing Solutions
AS SEEN ON


Are You a Licensed Real Estate Agent or Broker?