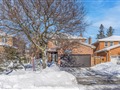
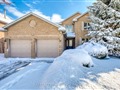
1129 Lansdown Dr
$2,210,550
Comparative Market Analysis
Jun 1, 2025
NOT AN ACTIVE LISTING
Historical Performance
| Period | $ Change | % Change |
| 1 Day | +$536 | +0.024% |
| 7 Days | +$351 | +0.016% |
| 30 Days | -$3,308 | -0.149% |
| 3 Months | -$3,168 | -0.143% |
| 6 Months | +$44.2k | +2.04% |
| 1 Year | -$87.3k | -3.80% |
| 3 Years | +$442k | +25.0% |
| 5 Years | +$753k | +51.7% |
| 10 Years | +$1.44m | +187% |
List My Property
Real Estate Statistics
Financing Solutions
AS SEEN ON

Are You a Licensed Real Estate Agent or Broker?