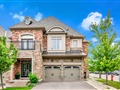
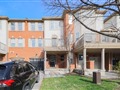
2008 Deerview Common
$1,102,586
Comparative Market Analysis
Apr 23, 2024
NOT AN ACTIVE LISTING
Historical Performance
| Period | $ Change | % Change |
| 1 Day | +$595 | +0.054% |
| 7 Days | +$1,461 | +0.133% |
| 30 Days | -$1,671 | -0.151% |
| 3 Months | -$5,649 | -0.510% |
| 6 Months | +$13.8k | +1.27% |
| 1 Year | -$56.0k | -4.83% |
| 3 Years | +$159k | +16.8% |
| 5 Years | +$267k | +31.9% |
| 10 Years | +$557k | +102% |
List My Property
Real Estate Statistics
Financing Solutions
AS SEEN ON


Are You a Licensed Real Estate Agent or Broker?